Product
One operating model, from market signal to won work.
New Dynamics is not a place to file contacts. It is the working surface for how a professional services firm wins work: seven connected stages, each answering a question your firm already asks every week.
Which projects and buyers should we know about this week?
Market Radar watches live UK tender feeds (Find a Tender and Contracts Finder) alongside planning and framework activity. Every notice is scored against your sectors, regions, values and evidence base, with the reasoning written out, then triaged into pursue, nurture, watch or dismiss.
- Live public tender sources, scanned on demand or on schedule
- Explainable BD fit score on every signal
- Watchlists for buyers, sectors and regions
- Approval queue that converts a signal into a pursuit
In practice
A tender for consultancy services scores 72/100 because education is a core firm sector and the buyer is already in the client base, with the biggest gap (no live framework route) named alongside.
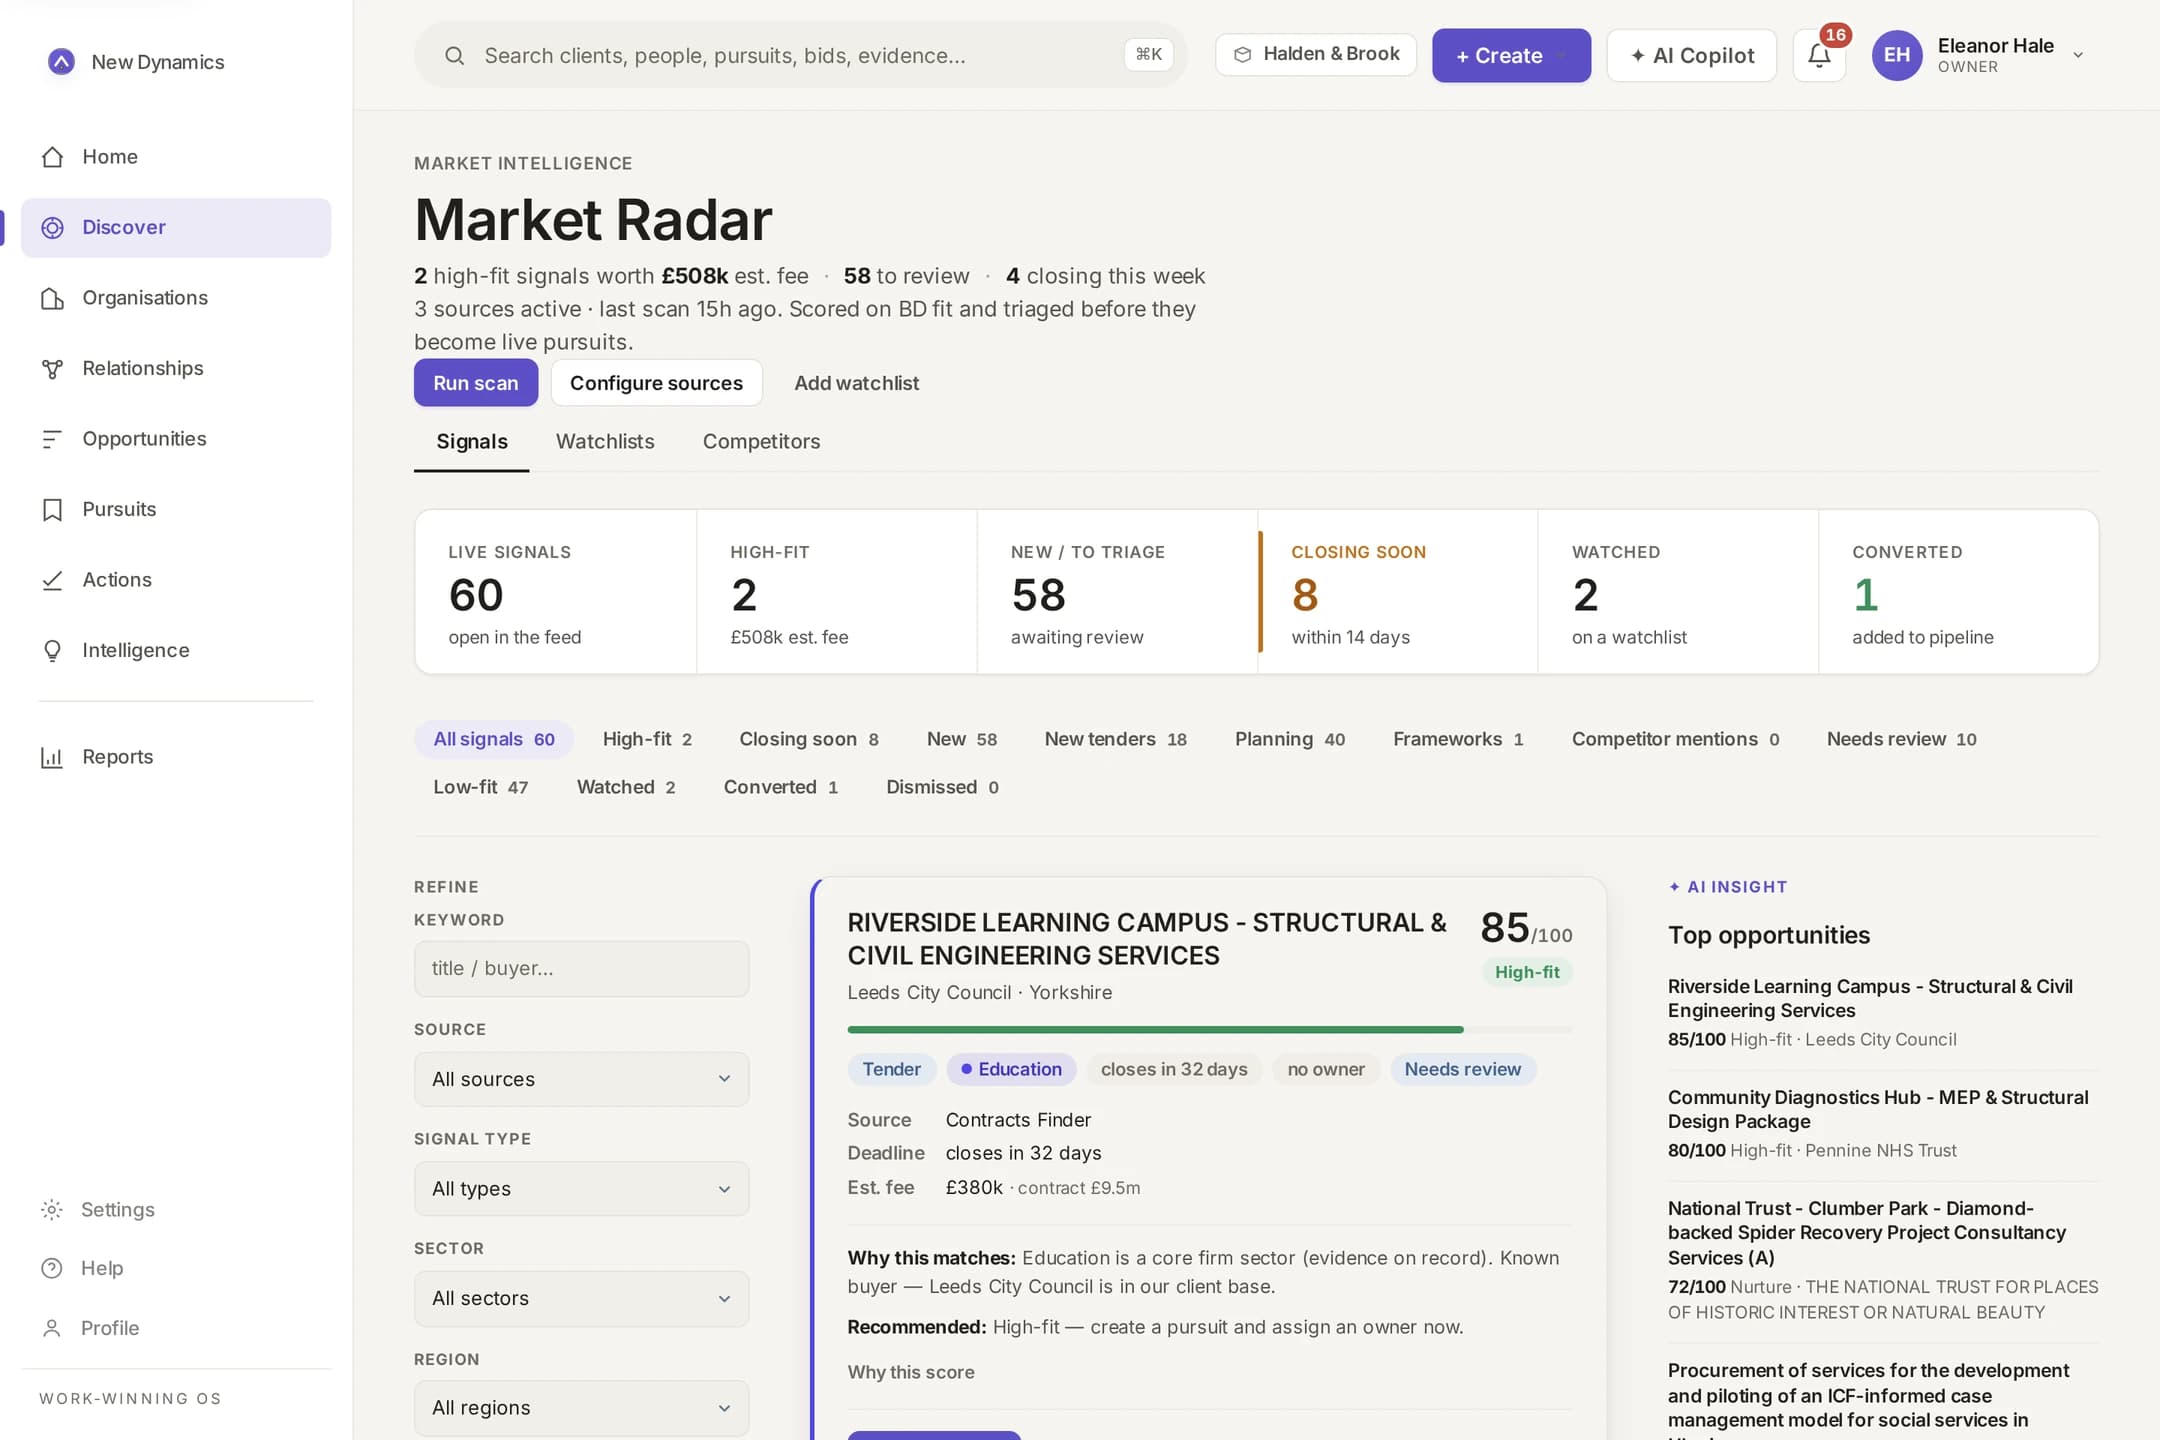
Core sector, evidence on record
25/25
Buyer already in the client base
20/20
Deadline workable
10/10
Region match
10/15
Framework route
7/15
The score is explained, not oracular, and the biggest gap (no live framework route) is exactly what the firm would need to fix to bid well.
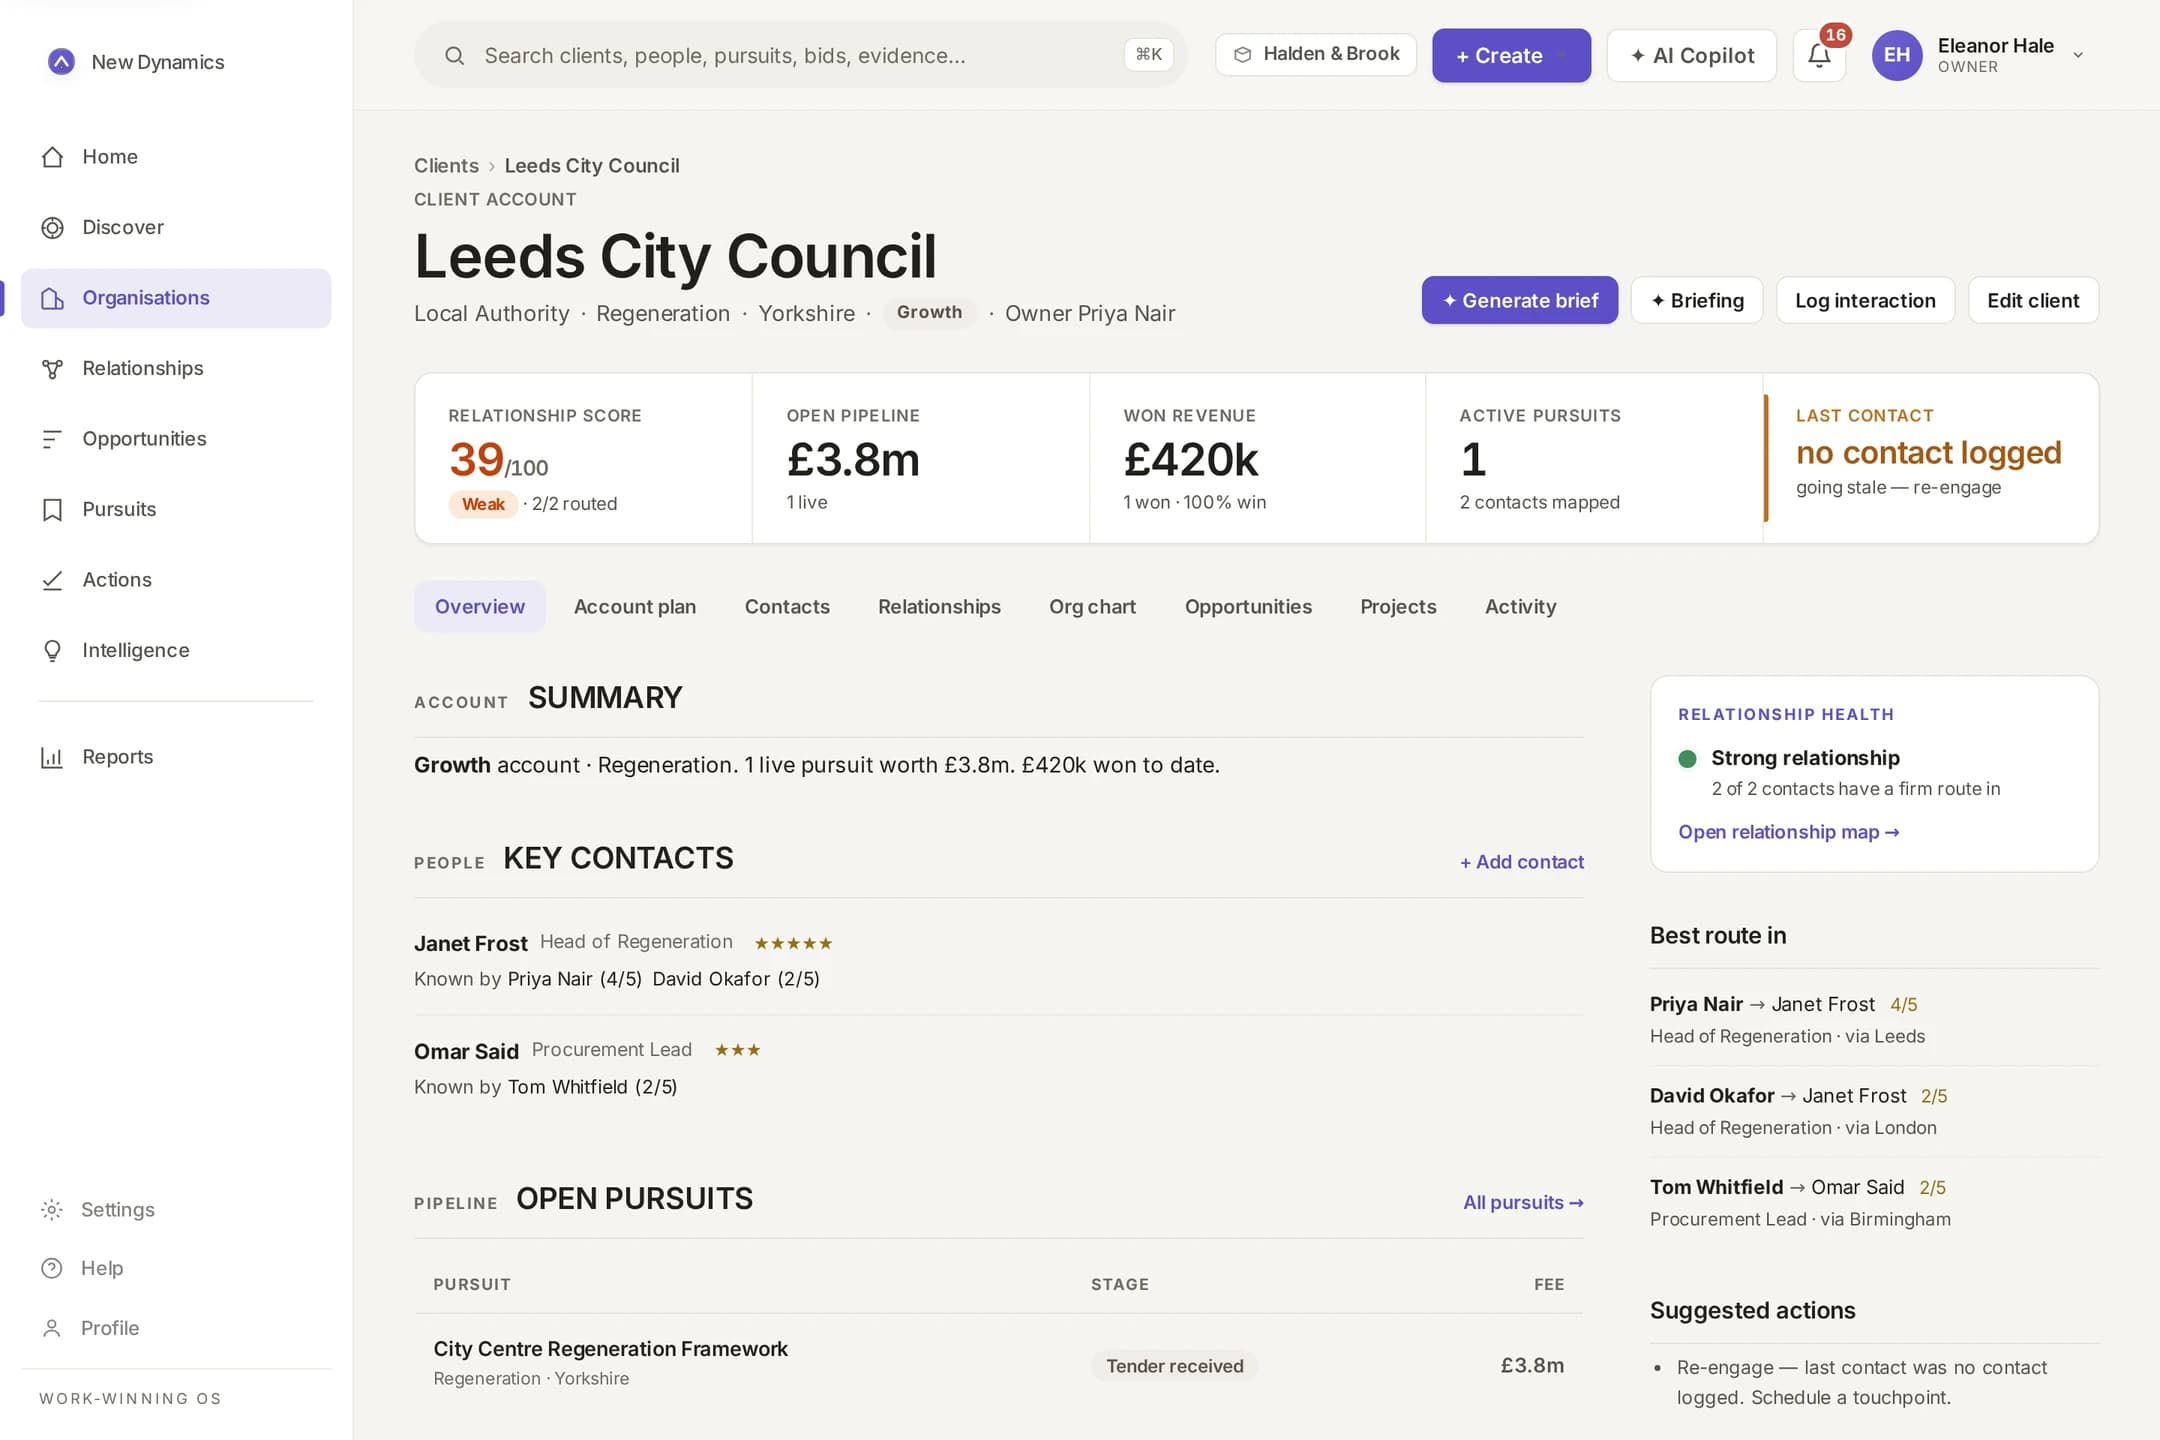
Who is behind this project, and what do we already know about them?
Every developer, contractor, authority or client is one organisation record: its sector, region, live opportunities, key contacts, interaction history and account plan, instead of five spellings of the same name across five spreadsheets.
- One profile per organisation with pipeline and history
- Key contacts with influence and coverage state
- Account plans with 90-day objectives
- Companies House enrichment
In practice
Before a first meeting with a developer, a partner sees the two live pursuits with that organisation, who owns each relationship, and the account objective agreed last quarter.
Who already has the strongest relationship with this organisation?
The coverage matrix lays out every key contact: who owns the relationship, how strong it is, when it was last active and the best route in. High-influence contacts with no route are flagged first, the gaps are the point, not a blank cell.
- Coverage matrix across the client book
- Connection matrix: who knows whom, firm-wide
- Best route in, ranked by relationship strength
- Suggested introductions when a gap has a nearby route
In practice
A Chief Finance Officer at a key client has no active relationship, but the matrix shows a colleague two steps away with a 5/5 route, so the intro plan starts from strength rather than cold.
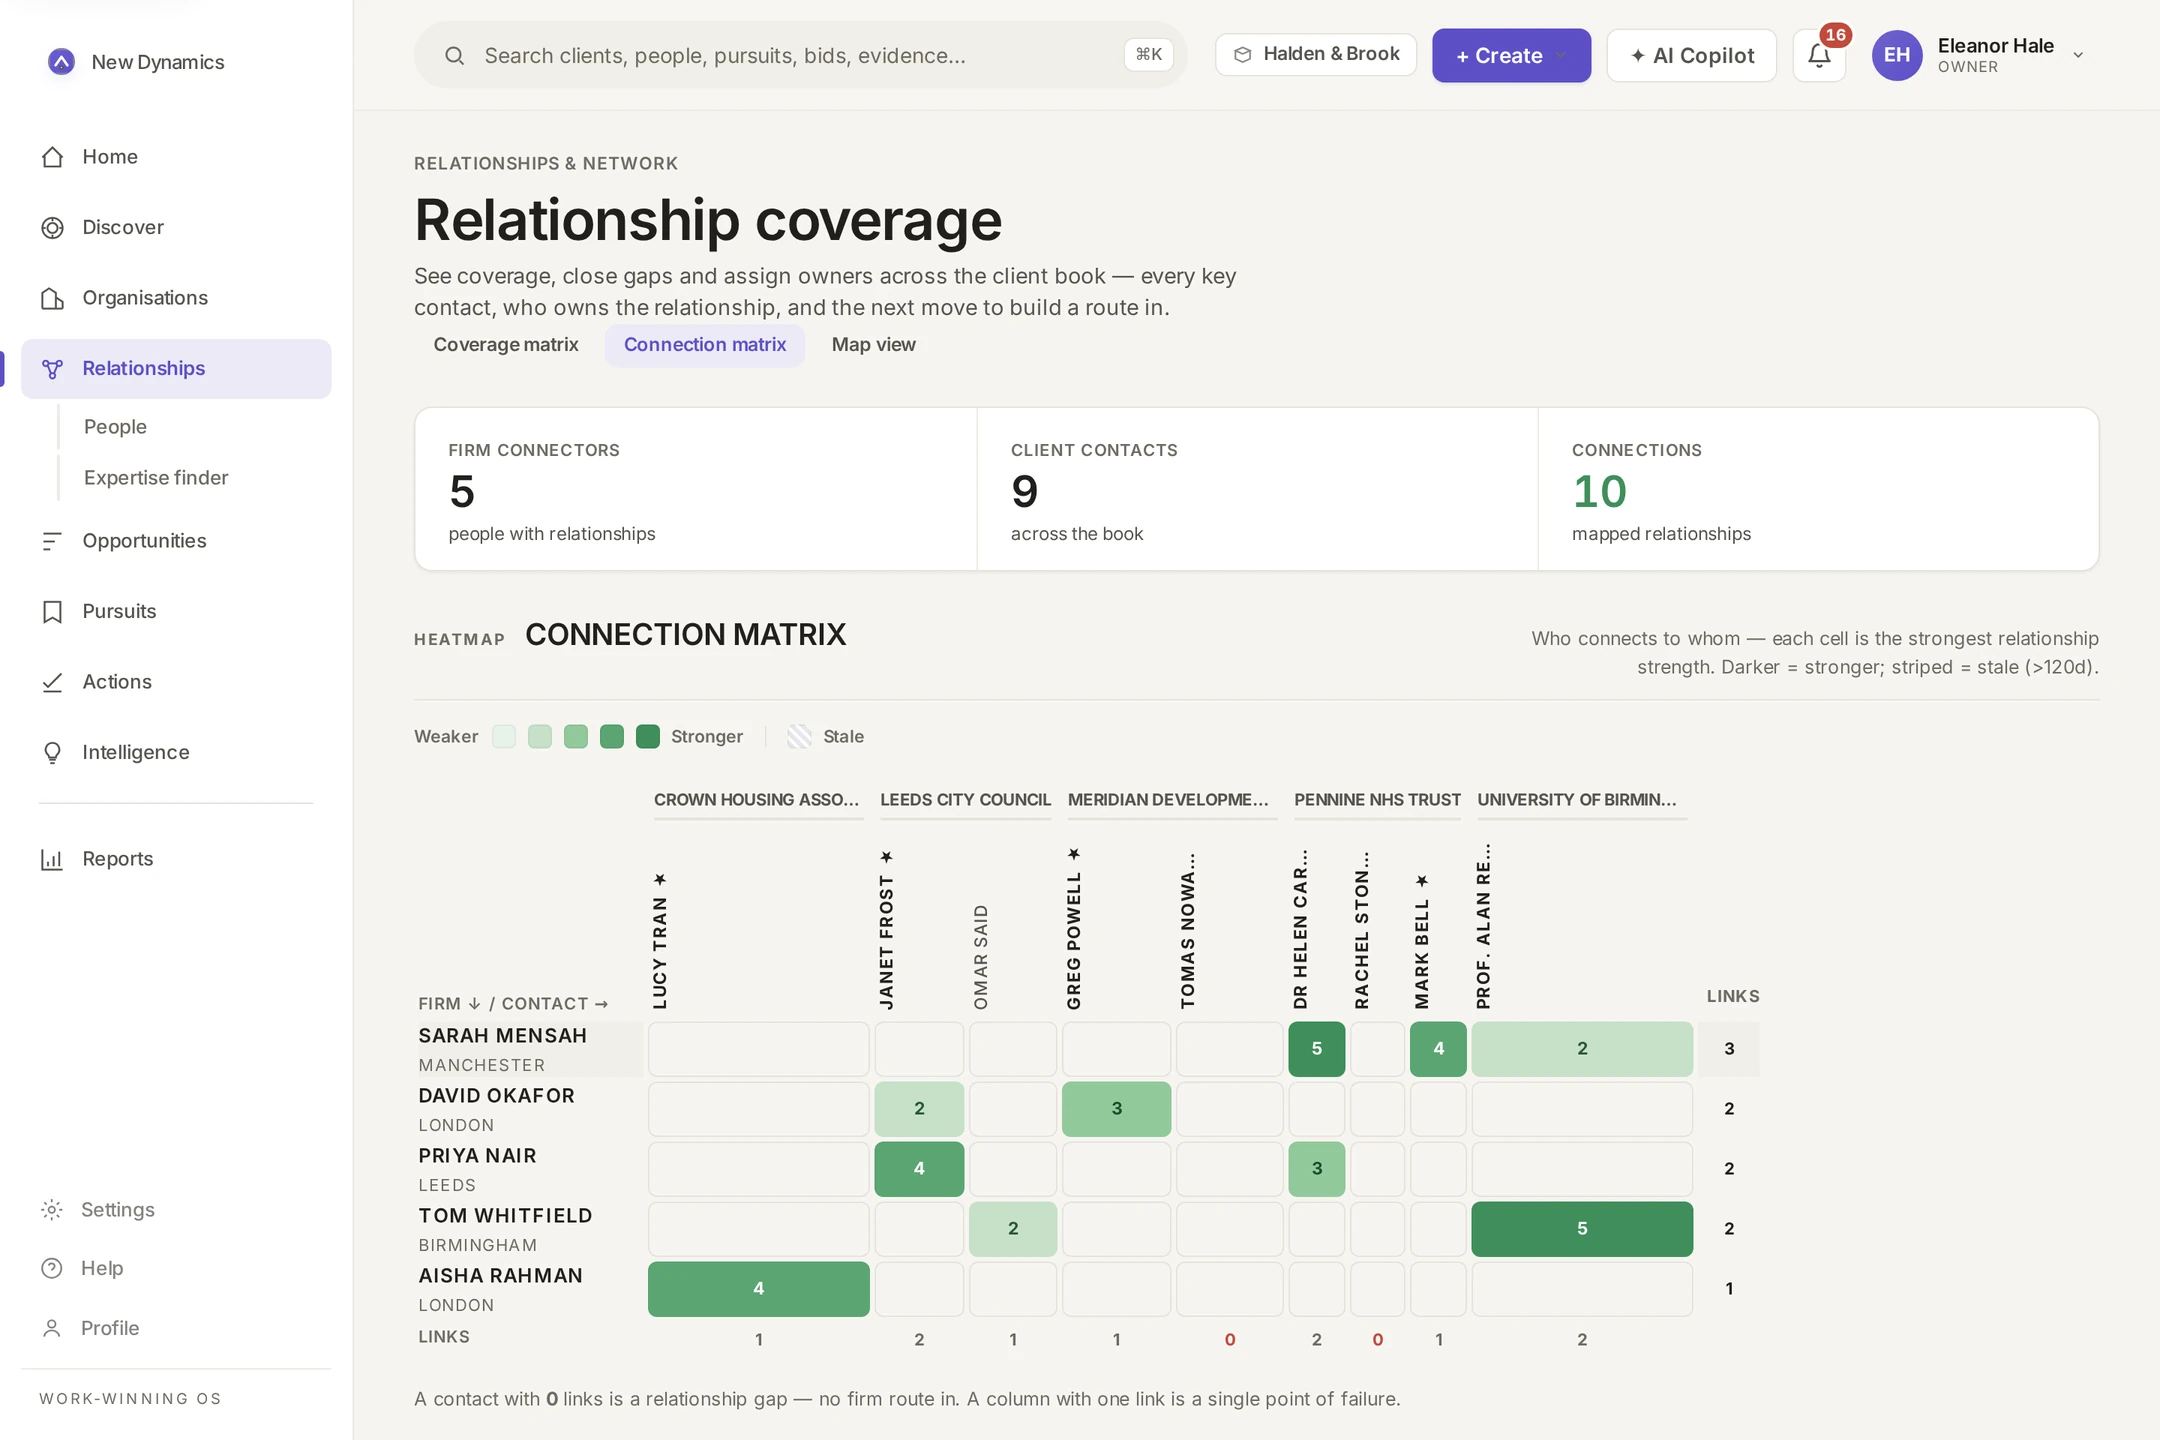
| Decision-maker | Owner | Last touch | Best route in |
|---|---|---|---|
| Greg PowellManaging Director | David Okafor | 4w ago | active · 4/5 |
| Rachel StoneChief Finance Officer | no owner | never | via Dr Helen Carr · 5/5 |
| Tomas NowakHead of Acquisitions | no owner | never | via Greg Powell · 3/5 |
Two high-influence contacts, nobody accountable, but each with a colleague two steps away. That list is the month’s BD agenda.
What are we actually pursuing, and what is it worth?
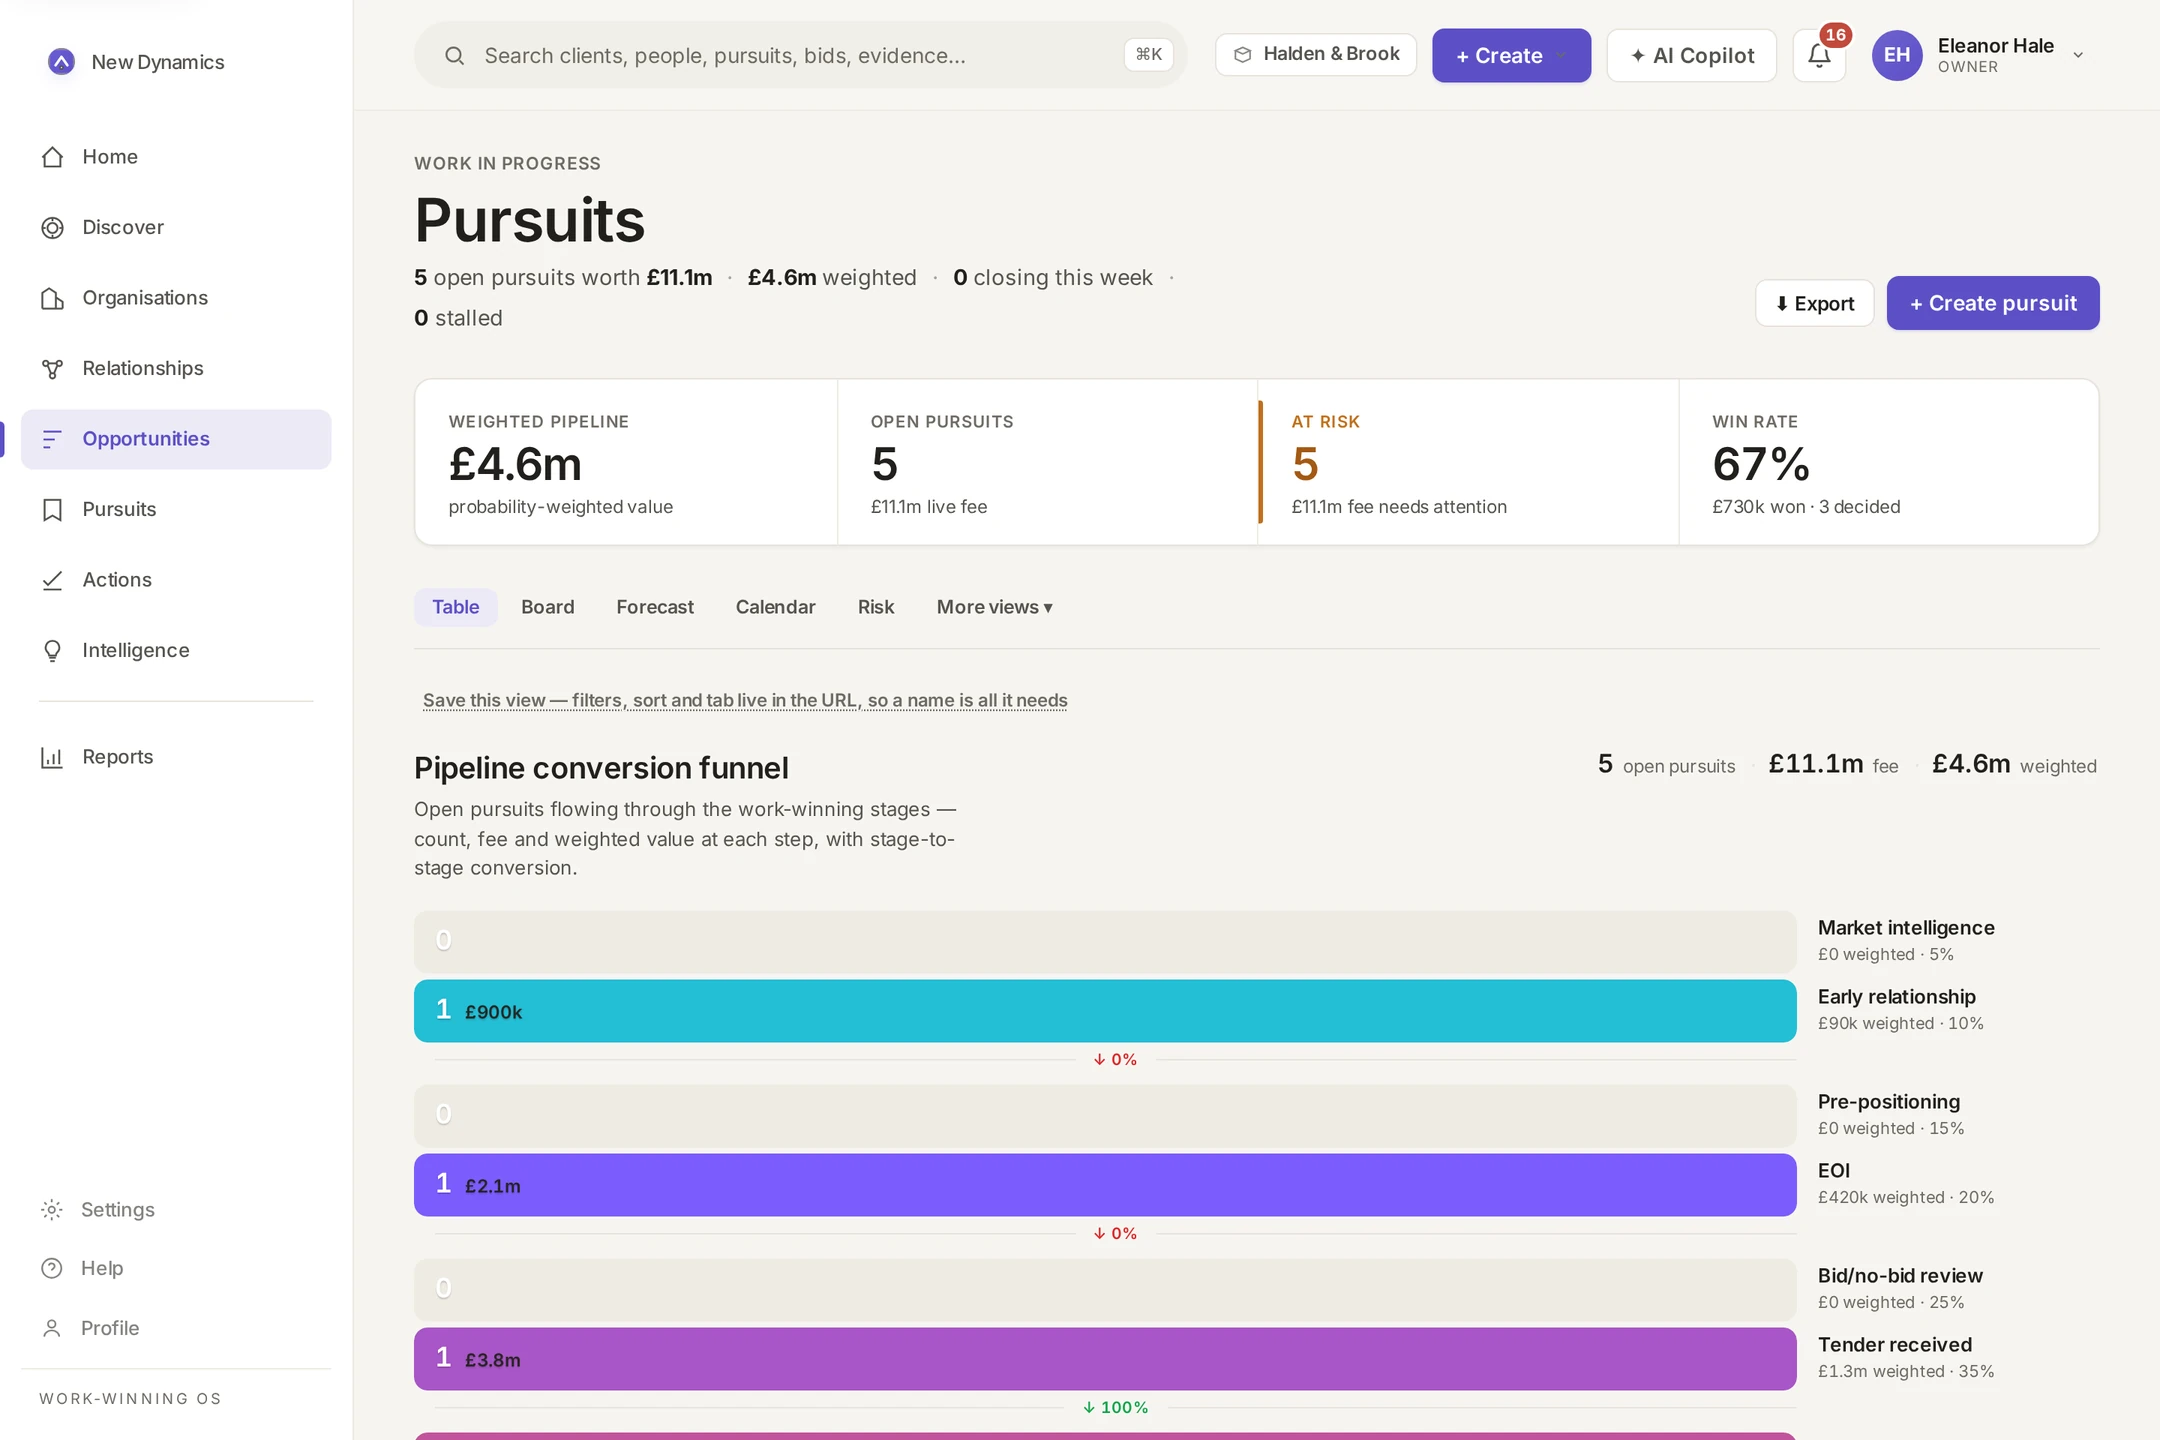
Signals, referrals and conversations become opportunity records with an estimated fee, a stage, a win probability and a weighted value. The pipeline is one filterable view, table, board, calendar, sector or risk, not a spreadsheet per team.
- Stage-based pipeline with weighted values
- Configurable stages, sectors and scoring
- Saved views that live in the URL
- Excel import and export
In practice
Five live pursuits carry £11.1m of fees; applying stage probabilities makes the honest number £4.6m, visible to everyone, argued about openly, and exportable for the board pack.
Is this bid worth winning, and how will we win it?
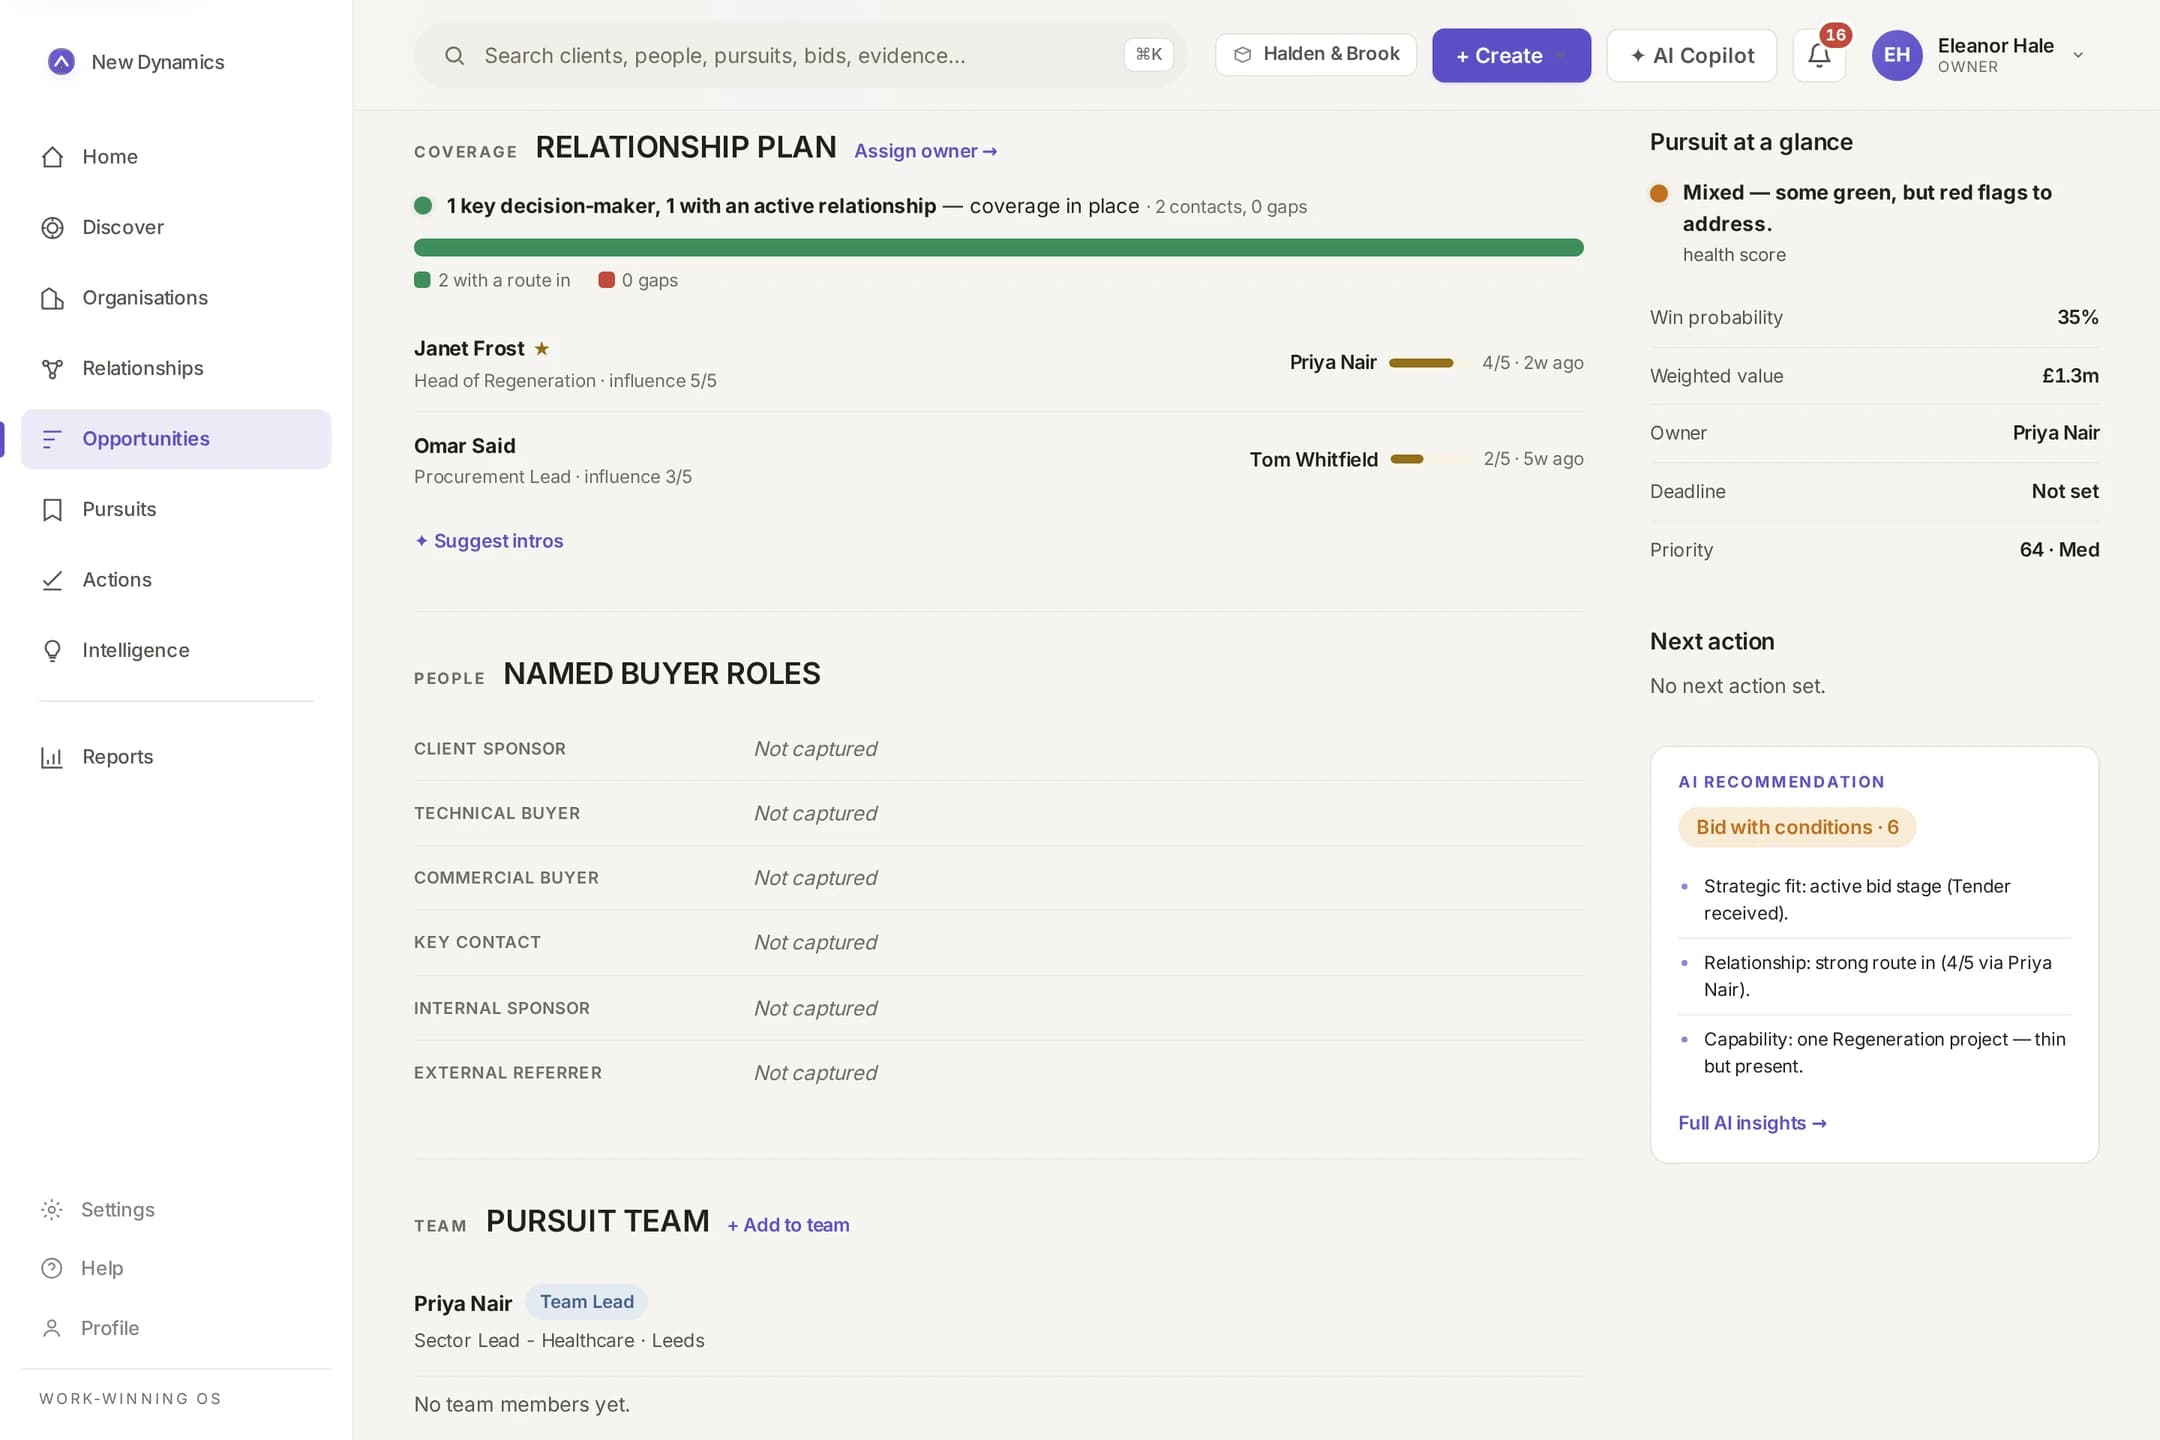
Each pursuit is a workspace: commercial summary, structured qualification and bid/no-bid, the relationship plan per decision-maker, matched evidence from past projects, and the team. The argument for bidding lives on the record, not in someone's inbox.
- Qualification scorecard and bid/no-bid decision
- Relationship plan with named buyer roles
- Evidence library matched to the pursuit
- Health score with red flags written out
In practice
A £3.8m regeneration framework shows a strong route to the Head of Regeneration (4/5 via a sector lead) but no client sponsor captured, so the next move is obvious before the tender deadline is set.
What should happen next, and who owns it?
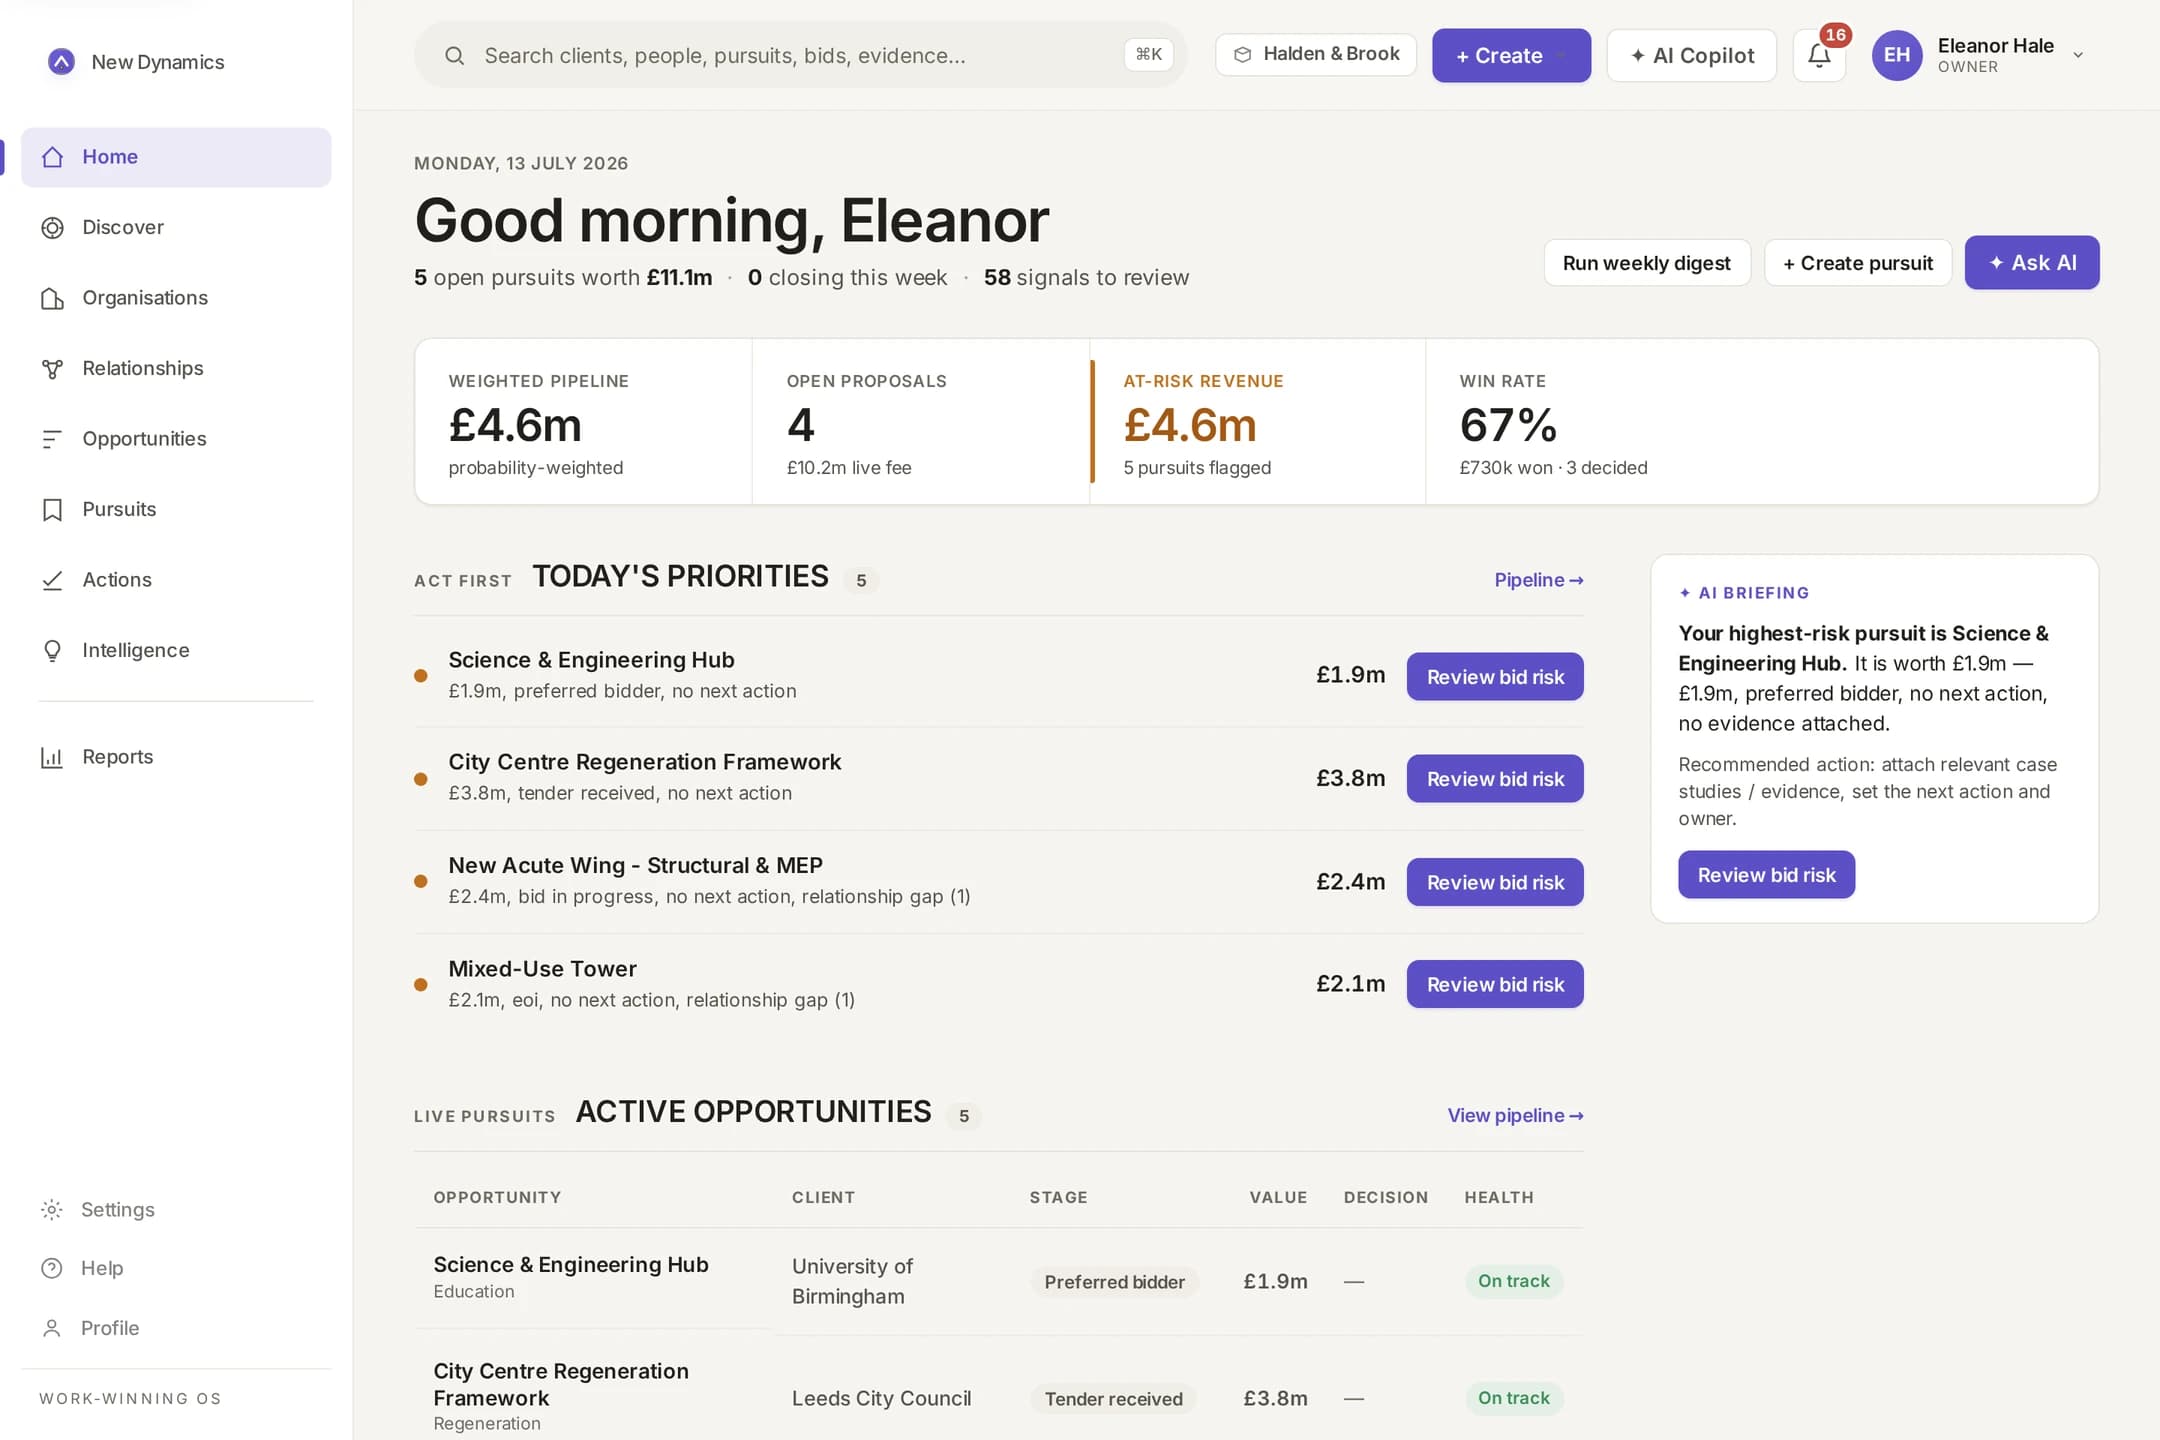
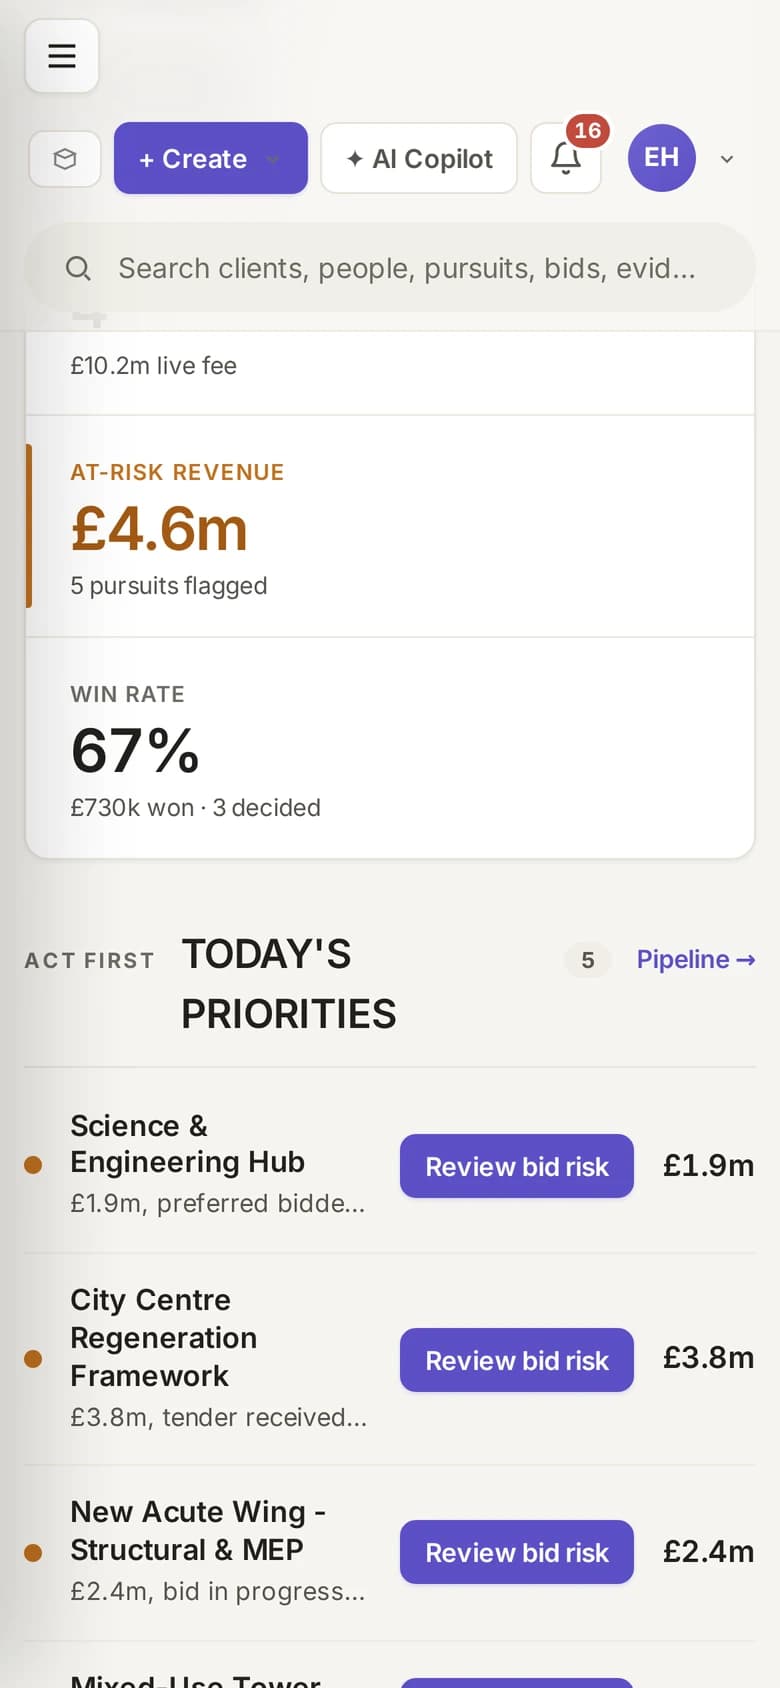
Actions belong to pursuits, accounts and relationships, each with an owner and a date, ranked by the revenue they protect. A pursuit with no next action is treated as a defect and surfaces in the priority feed until someone owns the next move.
- Actions linked to opportunities and accounts
- Ranked priority feed on the Today screen
- ‘No next action’ flagged per pursuit
- Reminders and a what-changed stream
In practice
Four pursuits worth £10.2m have no next action set. They top the priority feed with one-click review, before they quietly become the at-risk column in next quarter's report.
Where will the work come from, and is the story improving?
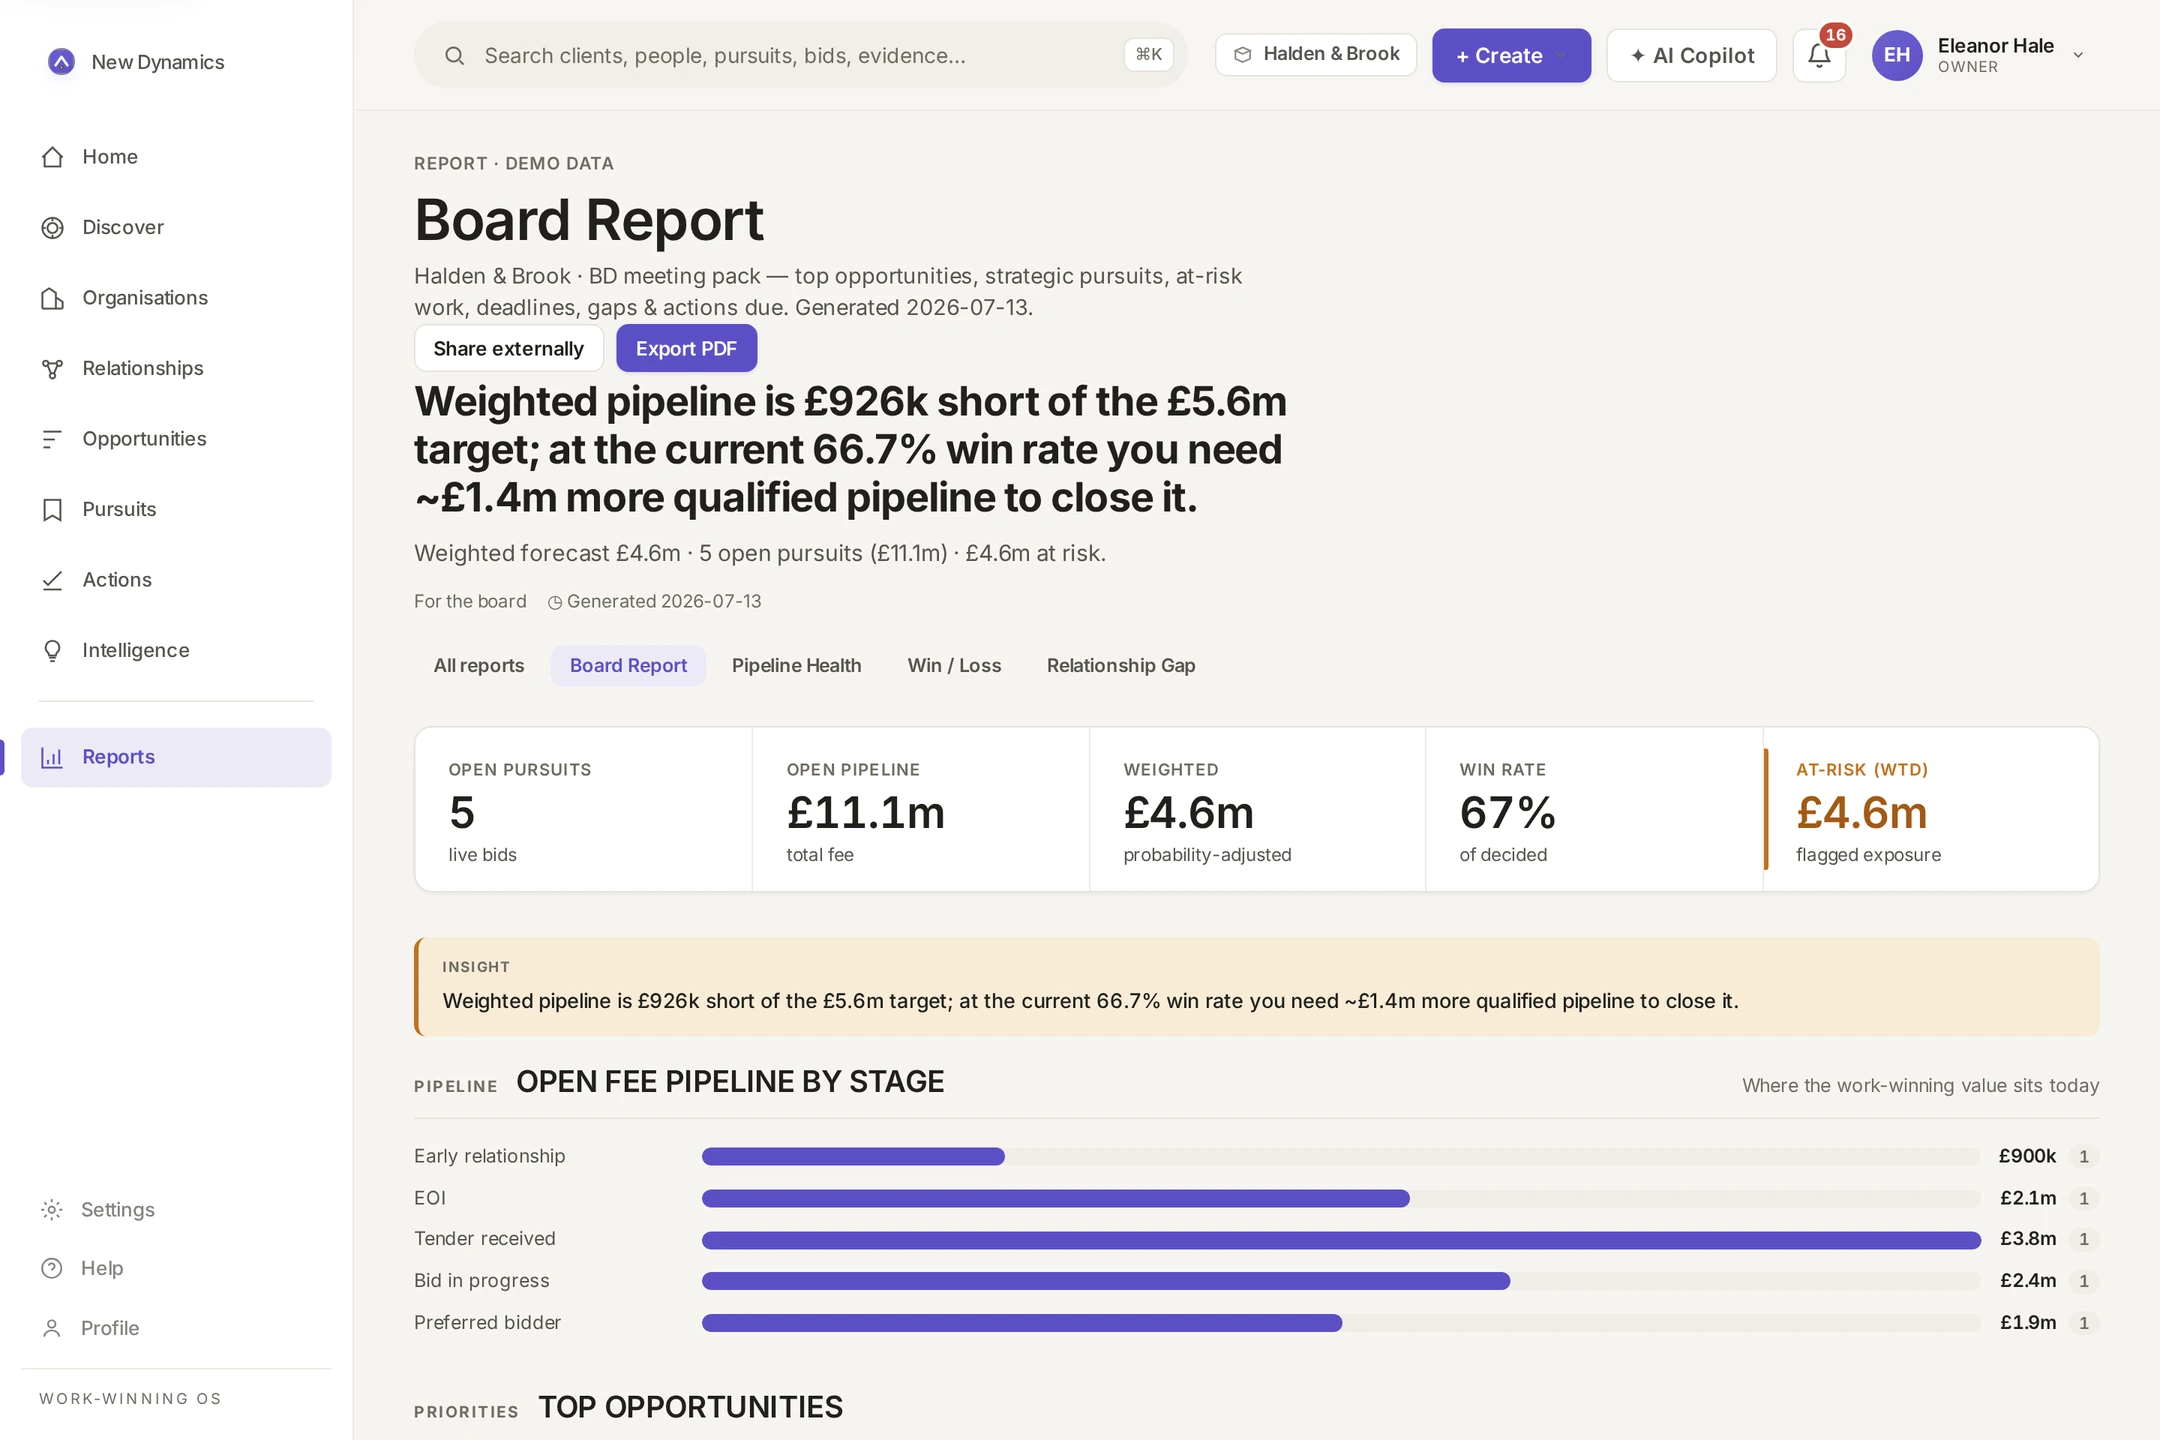
Reports are generated from the same records everyone works in: board pack, pipeline health, win/loss, sector and client performance, relationship gaps. Each writes its own plain-language insight from the data and exports to PDF.
- Board report with weighted pipeline vs target
- Win/loss and relationship-gap analysis
- Sector, client and framework performance
- PDF export for the partners' meeting
In practice
The board report states the weighted pipeline is £926k short of the £5.6m target and that at the current 67% win rate roughly £1.4m more qualified pipeline closes the gap, one sentence, from the data, before anyone builds a slide.
Science & Engineering Hub
£1.9m × 90% = £1.7m
City Centre Regeneration Fwk
£3.8m × 35% = £1.3m
New Acute Wing
£2.4m × 40% = £1.0m
Mixed-Use Tower
£2.1m × 25% = £0.5m
Estate Retrofit Programme
£0.9m × 10% = £0.1m
See these seven stages running on your firm's kind of work.
A demonstration follows one realistic pursuit for your industry from first signal to the board report, using the workflows above, not a slide deck.